Monitoring 
Two different methods to install and configure Prometheus and Grafana are described in this doc.
- Prometheus and Grafana installation using Pod Annotations. This installs Prometheus and Grafana in the same namespace as NGINX Ingress
- Prometheus and Grafana installation using Service Monitors. This installs Prometheus and Grafana in two different namespaces. This is the preferred method, and helm charts supports this by default.
Prometheus and Grafana installation using Pod Annotations 
This tutorial will show you how to install Prometheus and Grafana for scraping the metrics of the Ingress-Nginx Controller.
Important
This example uses emptyDir volumes for Prometheus and Grafana. This means once the pod gets terminated you will lose all the data.
Before You Begin 
-
The Ingress-Nginx Controller should already be deployed according to the deployment instructions here.
-
The controller should be configured for exporting metrics. This requires 3 configurations to the controller. These configurations are:
- controller.metrics.enabled=true
- controller.podAnnotations."prometheus.io/scrape"="true"
-
controller.podAnnotations."prometheus.io/port"="10254"
-
The easiest way to configure the controller for metrics is via helm upgrade. Assuming you have installed the ingress-nginx controller as a helm release named ingress-nginx, then you can simply type the command shown below :
helm upgrade ingress-nginx ingress-nginx \ --repo https://kubernetes.github.io/ingress-nginx \ --namespace ingress-nginx \ --set controller.metrics.enabled=true \ --set-string controller.podAnnotations."prometheus\.io/scrape"="true" \ --set-string controller.podAnnotations."prometheus\.io/port"="10254" - You can validate that the controller is configured for metrics by looking at the values of the installed release, like this:
helm get values ingress-nginx --namespace ingress-nginx - You should be able to see the values shown below:
.. controller: metrics: enabled: true podAnnotations: prometheus.io/port: "10254" prometheus.io/scrape: "true" .. - If you are not using helm, you will have to edit your manifests like this:
- Service manifest:
apiVersion: v1 kind: Service .. spec: ports: - name: prometheus port: 10254 targetPort: prometheus .. - Deployment manifest:
apiVersion: v1
kind: Deployment
..
spec:
  template:
    metadata:
      annotations:
        prometheus.io/scrape: "true"
        prometheus.io/port: "10254"
    spec:
      containers:
        - name: controller
          args:
            ..
            - '--enable-metrics=true'
          ports:
            - name: prometheus
              containerPort: 10254
            ..
- Service manifest:
Deploy and configure Prometheus Server 
Note that the kustomize bases used in this tutorial are stored in the deploy folder of the GitHub repository kubernetes/ingress-nginx.
-
The Prometheus server must be configured so that it can discover endpoints of services. If a Prometheus server is already running in the cluster and if it is configured in a way that it can find the ingress controller pods, no extra configuration is needed.
-
If there is no existing Prometheus server running, the rest of this tutorial will guide you through the steps needed to deploy a properly configured Prometheus server.
-
Running the following command deploys prometheus in Kubernetes:
kubectl apply --kustomize github.com/kubernetes/ingress-nginx/deploy/prometheus/
Prometheus Dashboard 
- Open Prometheus dashboard in a web browser:
kubectl get svc -n ingress-nginx
NAME                   TYPE        CLUSTER-IP      EXTERNAL-IP   PORT(S)                                      AGE
default-http-backend   ClusterIP   10.103.59.201   <none>        80/TCP                                       3d
ingress-nginx          NodePort    10.97.44.72     <none>        80:30100/TCP,443:30154/TCP,10254:32049/TCP   5h
prometheus-server      NodePort    10.98.233.86    <none>        9090:32630/TCP                               1m
- Obtain the IP address of the nodes in the running cluster:
kubectl get nodes -o wide
- In some cases where the node only have internal IP addresses we need to execute:
kubectl get nodes --selector=kubernetes.io/role!=master -o jsonpath={.items[*].status.addresses[?\(@.type==\"InternalIP\"\)].address}
10.192.0.2 10.192.0.3 10.192.0.4
-
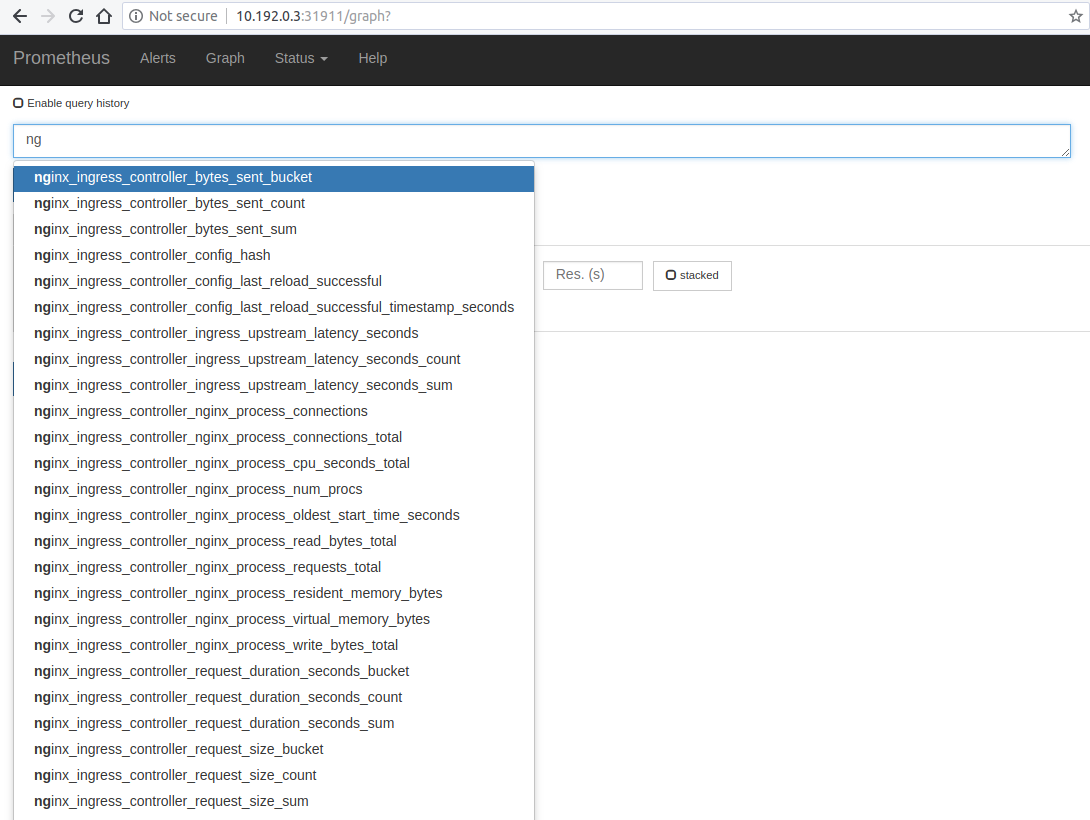
Open your browser and visit the following URL: http://{node IP address}:{prometheus-svc-nodeport} to load the Prometheus Dashboard.
-
According to the above example, this URL will be http://10.192.0.3:32630
Grafana 
- Install grafana using the below command
kubectl apply --kustomize github.com/kubernetes/ingress-nginx/deploy/grafana/ -
Look at the services
kubectl get svc -n ingress-nginx NAME TYPE CLUSTER-IP EXTERNAL-IP PORT(S) AGE default-http-backend ClusterIP 10.103.59.201 <none> 80/TCP 3d ingress-nginx NodePort 10.97.44.72 <none> 80:30100/TCP,443:30154/TCP,10254:32049/TCP 5h prometheus-server NodePort 10.98.233.86 <none> 9090:32630/TCP 10m grafana NodePort 10.98.233.87 <none> 3000:31086/TCP 10m -
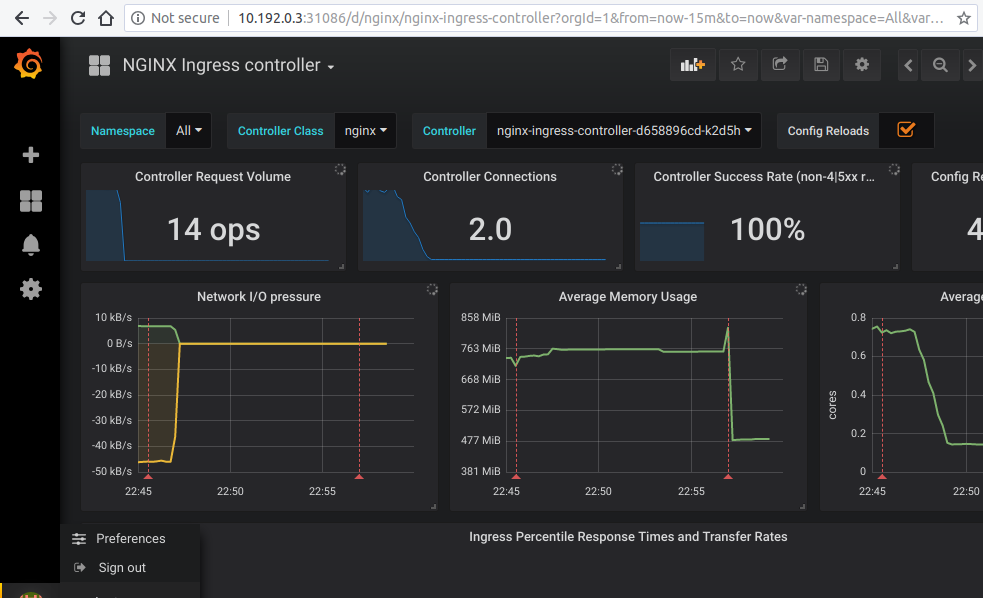
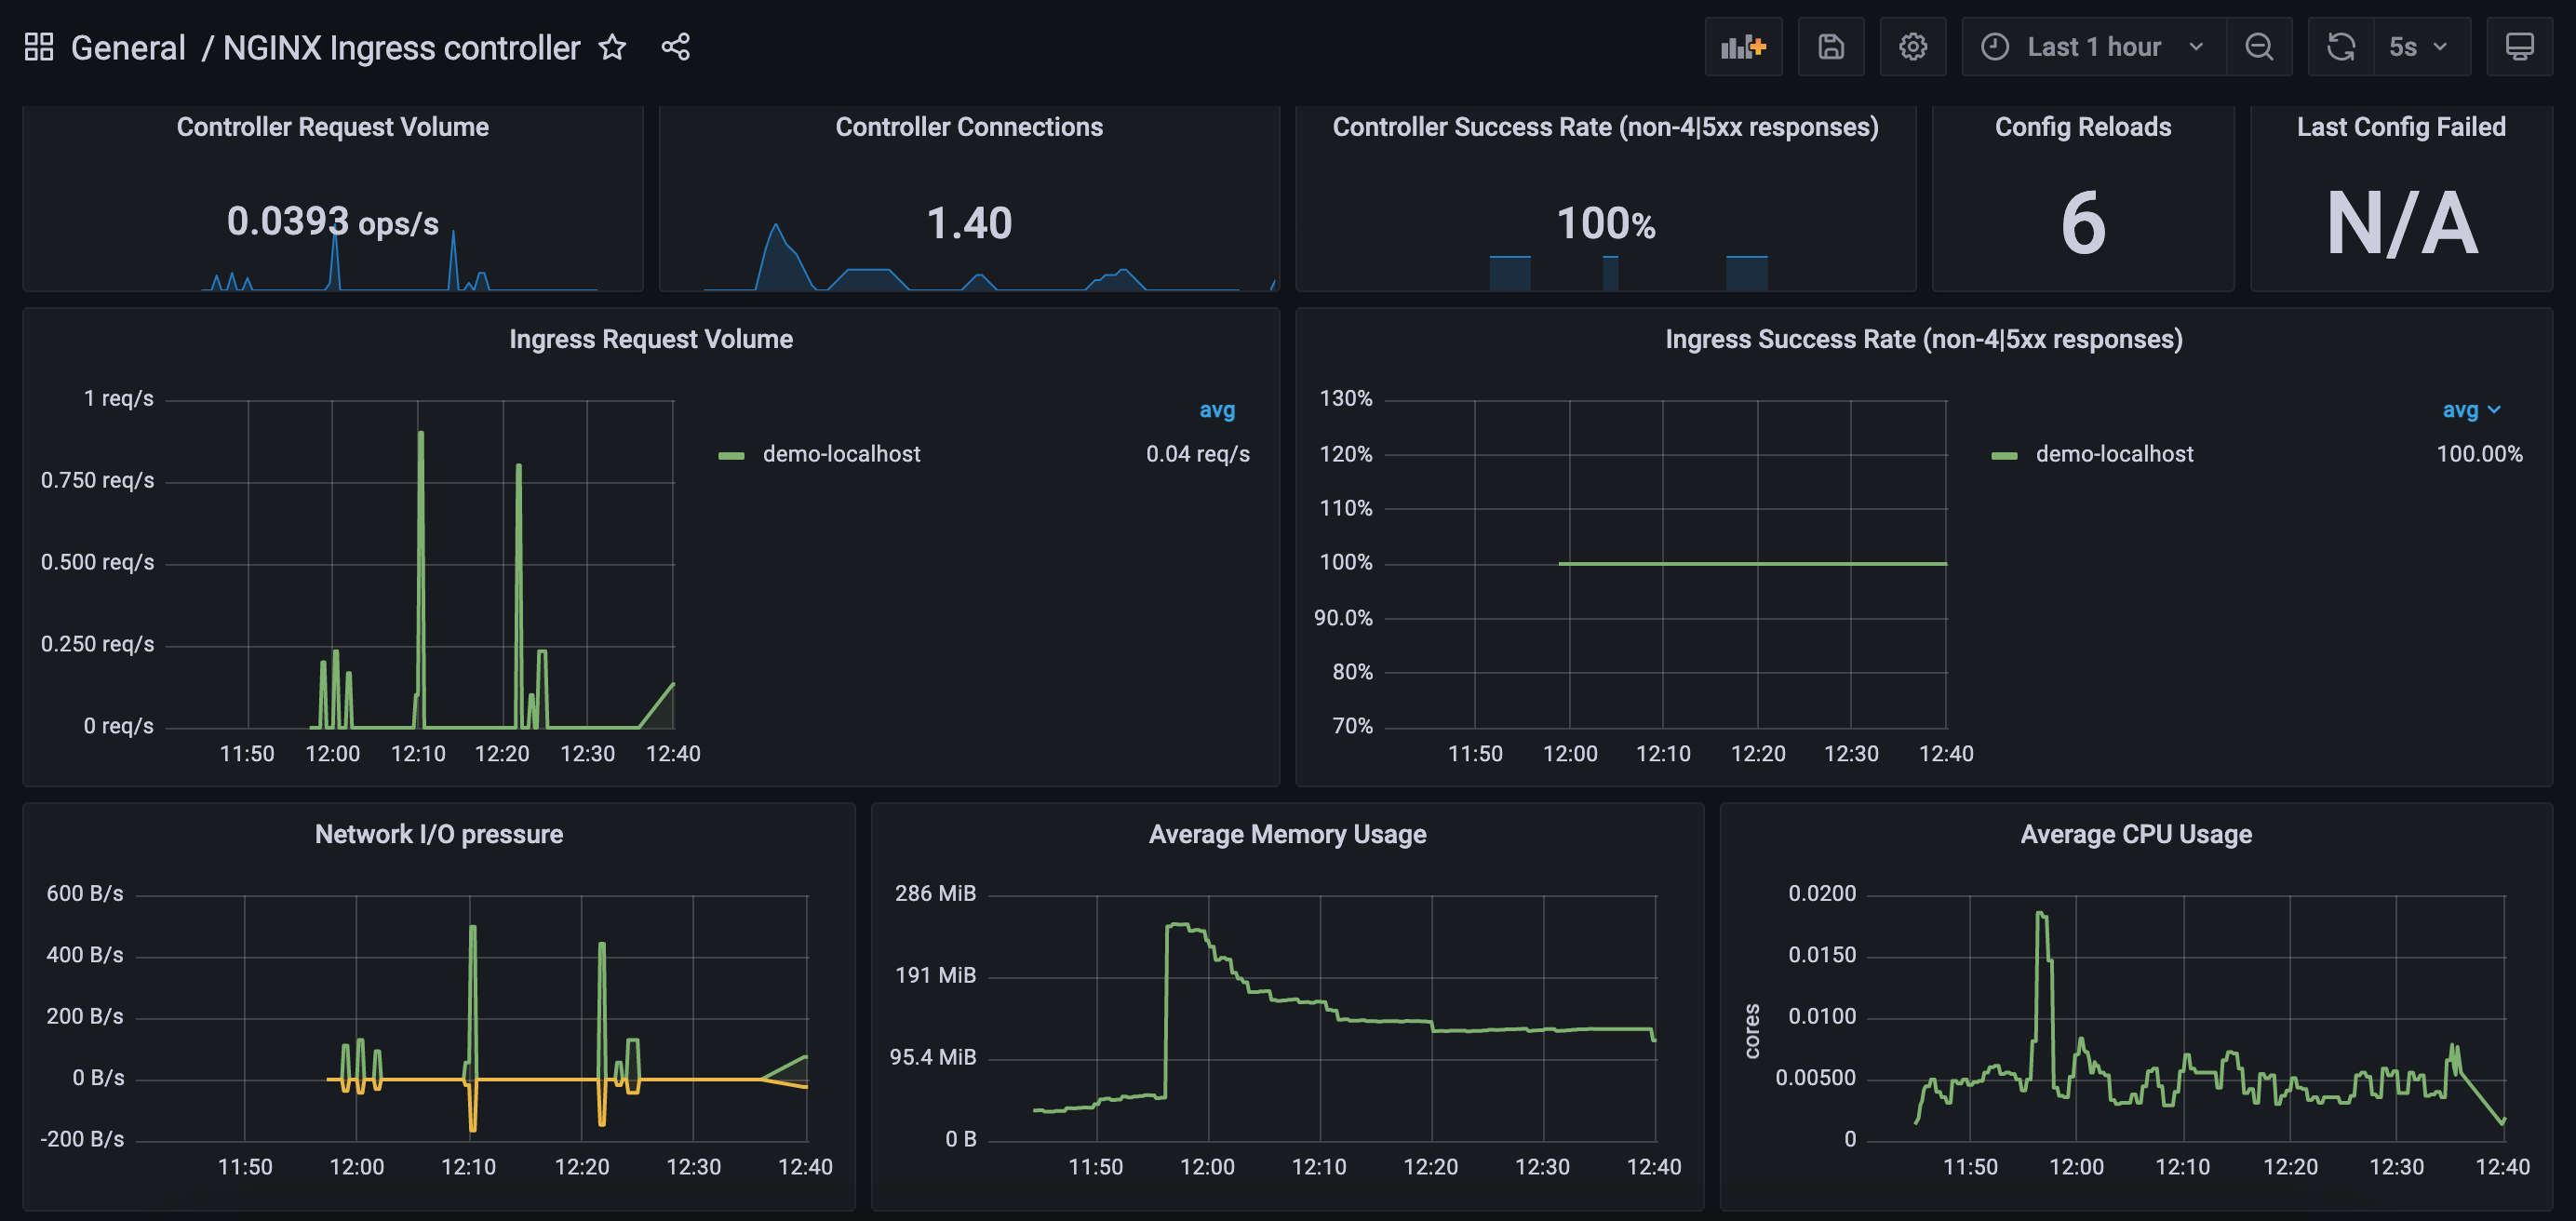
Open your browser and visit the following URL: http://{node IP address}:{grafana-svc-nodeport} to load the Grafana Dashboard. According to the above example, this URL will be http://10.192.0.3:31086
The username and password is admin
-
After the login you can import the Grafana dashboard from official dashboards, by following steps given below :
- Navigate to lefthand panel of grafana
- Hover on the gearwheel icon for Configuration and click "Data Sources"
- Click "Add data source"
- Select "Prometheus"
- Enter the details (note: I used http://CLUSTER_IP_PROMETHEUS_SVC:9090)
- Left menu (hover over +) -> Dashboard
- Click "Import"
- Enter the copy pasted json from https://raw.githubusercontent.com/kubernetes/ingress-nginx/main/deploy/grafana/dashboards/nginx.json
- Click Import JSON
- Select the Prometheus data source
- Click "Import"
Caveats 
Wildcard ingresses 
- By default request metrics are labeled with the hostname. When you have a wildcard domain ingress, then there will be no metrics for that ingress (to prevent the metrics from exploding in cardinality). To get metrics in this case you have two options:
- Run the ingress controller with
--metrics-per-host=false. You will lose labeling by hostname, but still have labeling by ingress. - Run the ingress controller with
--metrics-per-undefined-host=true --metrics-per-host=true. You will get labeling by hostname even if the hostname is not explicitly defined on an ingress. Be warned that cardinality could explode due to many hostnames and CPU usage could also increase.
- Run the ingress controller with
Grafana dashboard using ingress resource 
- If you want to expose the dashboard for grafana using an ingress resource, then you can :
- change the service type of the prometheus-server service and the grafana service to "ClusterIP" like this :
kubectl -n ingress-nginx edit svc grafana - This will open the currently deployed service grafana in the default editor configured in your shell (vi/nvim/nano/other)
- scroll down to line 34 that looks like "type: NodePort"
- change it to look like "type: ClusterIP". Save and exit.
- create an ingress resource with backend as "grafana" and port as "3000"
- change the service type of the prometheus-server service and the grafana service to "ClusterIP" like this :
- Similarly, you can edit the service "prometheus-server" and add an ingress resource.
Prometheus and Grafana installation using Service Monitors 
This document assumes you're using helm and using the kube-prometheus-stack package to install Prometheus and Grafana.
Verify Ingress-Nginx Controller is installed 
-
The Ingress-Nginx Controller should already be deployed according to the deployment instructions here.
-
To check if Ingress controller is deployed,
kubectl get pods -n ingress-nginx - The result should look something like:
NAME READY STATUS RESTARTS AGE ingress-nginx-controller-7c489dc7b7-ccrf6 1/1 Running 0 19h
Verify Prometheus is installed 
- To check if Prometheus is already deployed, run the following command:
helm ls -A
NAME          NAMESPACE       REVISION    UPDATED                                 STATUS      CHART                           APP VERSION
ingress-nginx ingress-nginx   10          2022-01-20 18:08:55.267373 -0800 PST    deployed    ingress-nginx-4.0.16            1.1.1
prometheus    prometheus      1           2022-01-20 16:07:25.086828 -0800 PST    deployed    kube-prometheus-stack-30.1.0    0.53.1
- If prometheus is not installed, then you can install from here
Re-configure Ingress-Nginx Controller 
- The Ingress NGINX controller needs to be reconfigured for exporting metrics. This requires 3 additional configurations to the controller. These configurations are :
controller.metrics.enabled=true controller.metrics.serviceMonitor.enabled=true controller.metrics.serviceMonitor.additionalLabels.release="prometheus" - The easiest way of doing this is to helm upgrade
helm upgrade ingress-nginx ingress-nginx/ingress-nginx \ --namespace ingress-nginx \ --set controller.metrics.enabled=true \ --set controller.metrics.serviceMonitor.enabled=true \ --set controller.metrics.serviceMonitor.additionalLabels.release="prometheus" -
Here
controller.metrics.serviceMonitor.additionalLabels.release="prometheus"should match the name of the helm release of thekube-prometheus-stack -
You can validate that the controller has been successfully reconfigured to export metrics by looking at the values of the installed release, like this:
helm get values ingress-nginx --namespace ingress-nginxcontroller: metrics: enabled: true serviceMonitor: additionalLabels: release: prometheus enabled: true
Configure Prometheus 
- Since Prometheus is running in a different namespace and not in the ingress-nginx namespace, it would not be able to discover ServiceMonitors in other namespaces when installed. Reconfigure your kube-prometheus-stack Helm installation to set
serviceMonitorSelectorNilUsesHelmValuesflag to false. By default, Prometheus only discovers PodMonitors within its own namespace. This should be disabled by settingpodMonitorSelectorNilUsesHelmValuesto false - The configurations required are:
prometheus.prometheusSpec.podMonitorSelectorNilUsesHelmValues=false prometheus.prometheusSpec.serviceMonitorSelectorNilUsesHelmValues=false - The easiest way of doing this is to use
helm upgrade ...helm upgrade prometheus prometheus-community/kube-prometheus-stack \ --namespace prometheus \ --set prometheus.prometheusSpec.podMonitorSelectorNilUsesHelmValues=false \ --set prometheus.prometheusSpec.serviceMonitorSelectorNilUsesHelmValues=false - You can validate that Prometheus has been reconfigured by looking at the values of the installed release, like this:
helm get values prometheus --namespace prometheus - You should be able to see the values shown below:
prometheus:
  prometheusSpec:
    podMonitorSelectorNilUsesHelmValues: false
    serviceMonitorSelectorNilUsesHelmValues: false
Connect and view Prometheus dashboard 
- Port forward to Prometheus service. Find out the name of the prometheus service by using the following command:
kubectl get svc -n prometheus
The result of this command would look like:
NAME                                      TYPE        CLUSTER-IP       EXTERNAL-IP   PORT(S)                      AGE
alertmanager-operated                     ClusterIP   None             <none>        9093/TCP,9094/TCP,9094/UDP   7h46m
prometheus-grafana                        ClusterIP   10.106.28.162    <none>        80/TCP                       7h46m
prometheus-kube-prometheus-alertmanager   ClusterIP   10.108.125.245   <none>        9093/TCP                     7h46m
prometheus-kube-prometheus-operator       ClusterIP   10.110.220.1     <none>        443/TCP                      7h46m
prometheus-kube-prometheus-prometheus     ClusterIP   10.102.72.134    <none>        9090/TCP                     7h46m
prometheus-kube-state-metrics             ClusterIP   10.104.231.181   <none>        8080/TCP                     7h46m
prometheus-operated                       ClusterIP   None             <none>        9090/TCP                     7h46m
prometheus-prometheus-node-exporter       ClusterIP   10.96.247.128    <none>        9100/TCP                     7h46m
kubectl port-forward svc/prometheus-kube-prometheus-prometheus -n prometheus 9090:9090
Forwarding from 127.0.0.1:9090 -> 9090
Forwarding from [::1]:9090 -> 9090
Connect and view Grafana dashboard 
- Port forward to Grafana service. Find out the name of the Grafana service by using the following command:
kubectl get svc -n prometheus
The result of this command would look like:
NAME                                      TYPE        CLUSTER-IP       EXTERNAL-IP   PORT(S)                      AGE
alertmanager-operated                     ClusterIP   None             <none>        9093/TCP,9094/TCP,9094/UDP   7h46m
prometheus-grafana                        ClusterIP   10.106.28.162    <none>        80/TCP                       7h46m
prometheus-kube-prometheus-alertmanager   ClusterIP   10.108.125.245   <none>        9093/TCP                     7h46m
prometheus-kube-prometheus-operator       ClusterIP   10.110.220.1     <none>        443/TCP                      7h46m
prometheus-kube-prometheus-prometheus     ClusterIP   10.102.72.134    <none>        9090/TCP                     7h46m
prometheus-kube-state-metrics             ClusterIP   10.104.231.181   <none>        8080/TCP                     7h46m
prometheus-operated                       ClusterIP   None             <none>        9090/TCP                     7h46m
prometheus-prometheus-node-exporter       ClusterIP   10.96.247.128    <none>        9100/TCP                     7h46m
kubectl port-forward svc/prometheus-grafana 3000:80 -n prometheus
Forwarding from 127.0.0.1:3000 -> 3000
Forwarding from [::1]:3000 -> 3000
- Navigate to lefthand panel of grafana
- Hover on the gearwheel icon for Configuration and click "Data Sources"
- Click "Add data source"
- Select "Prometheus"
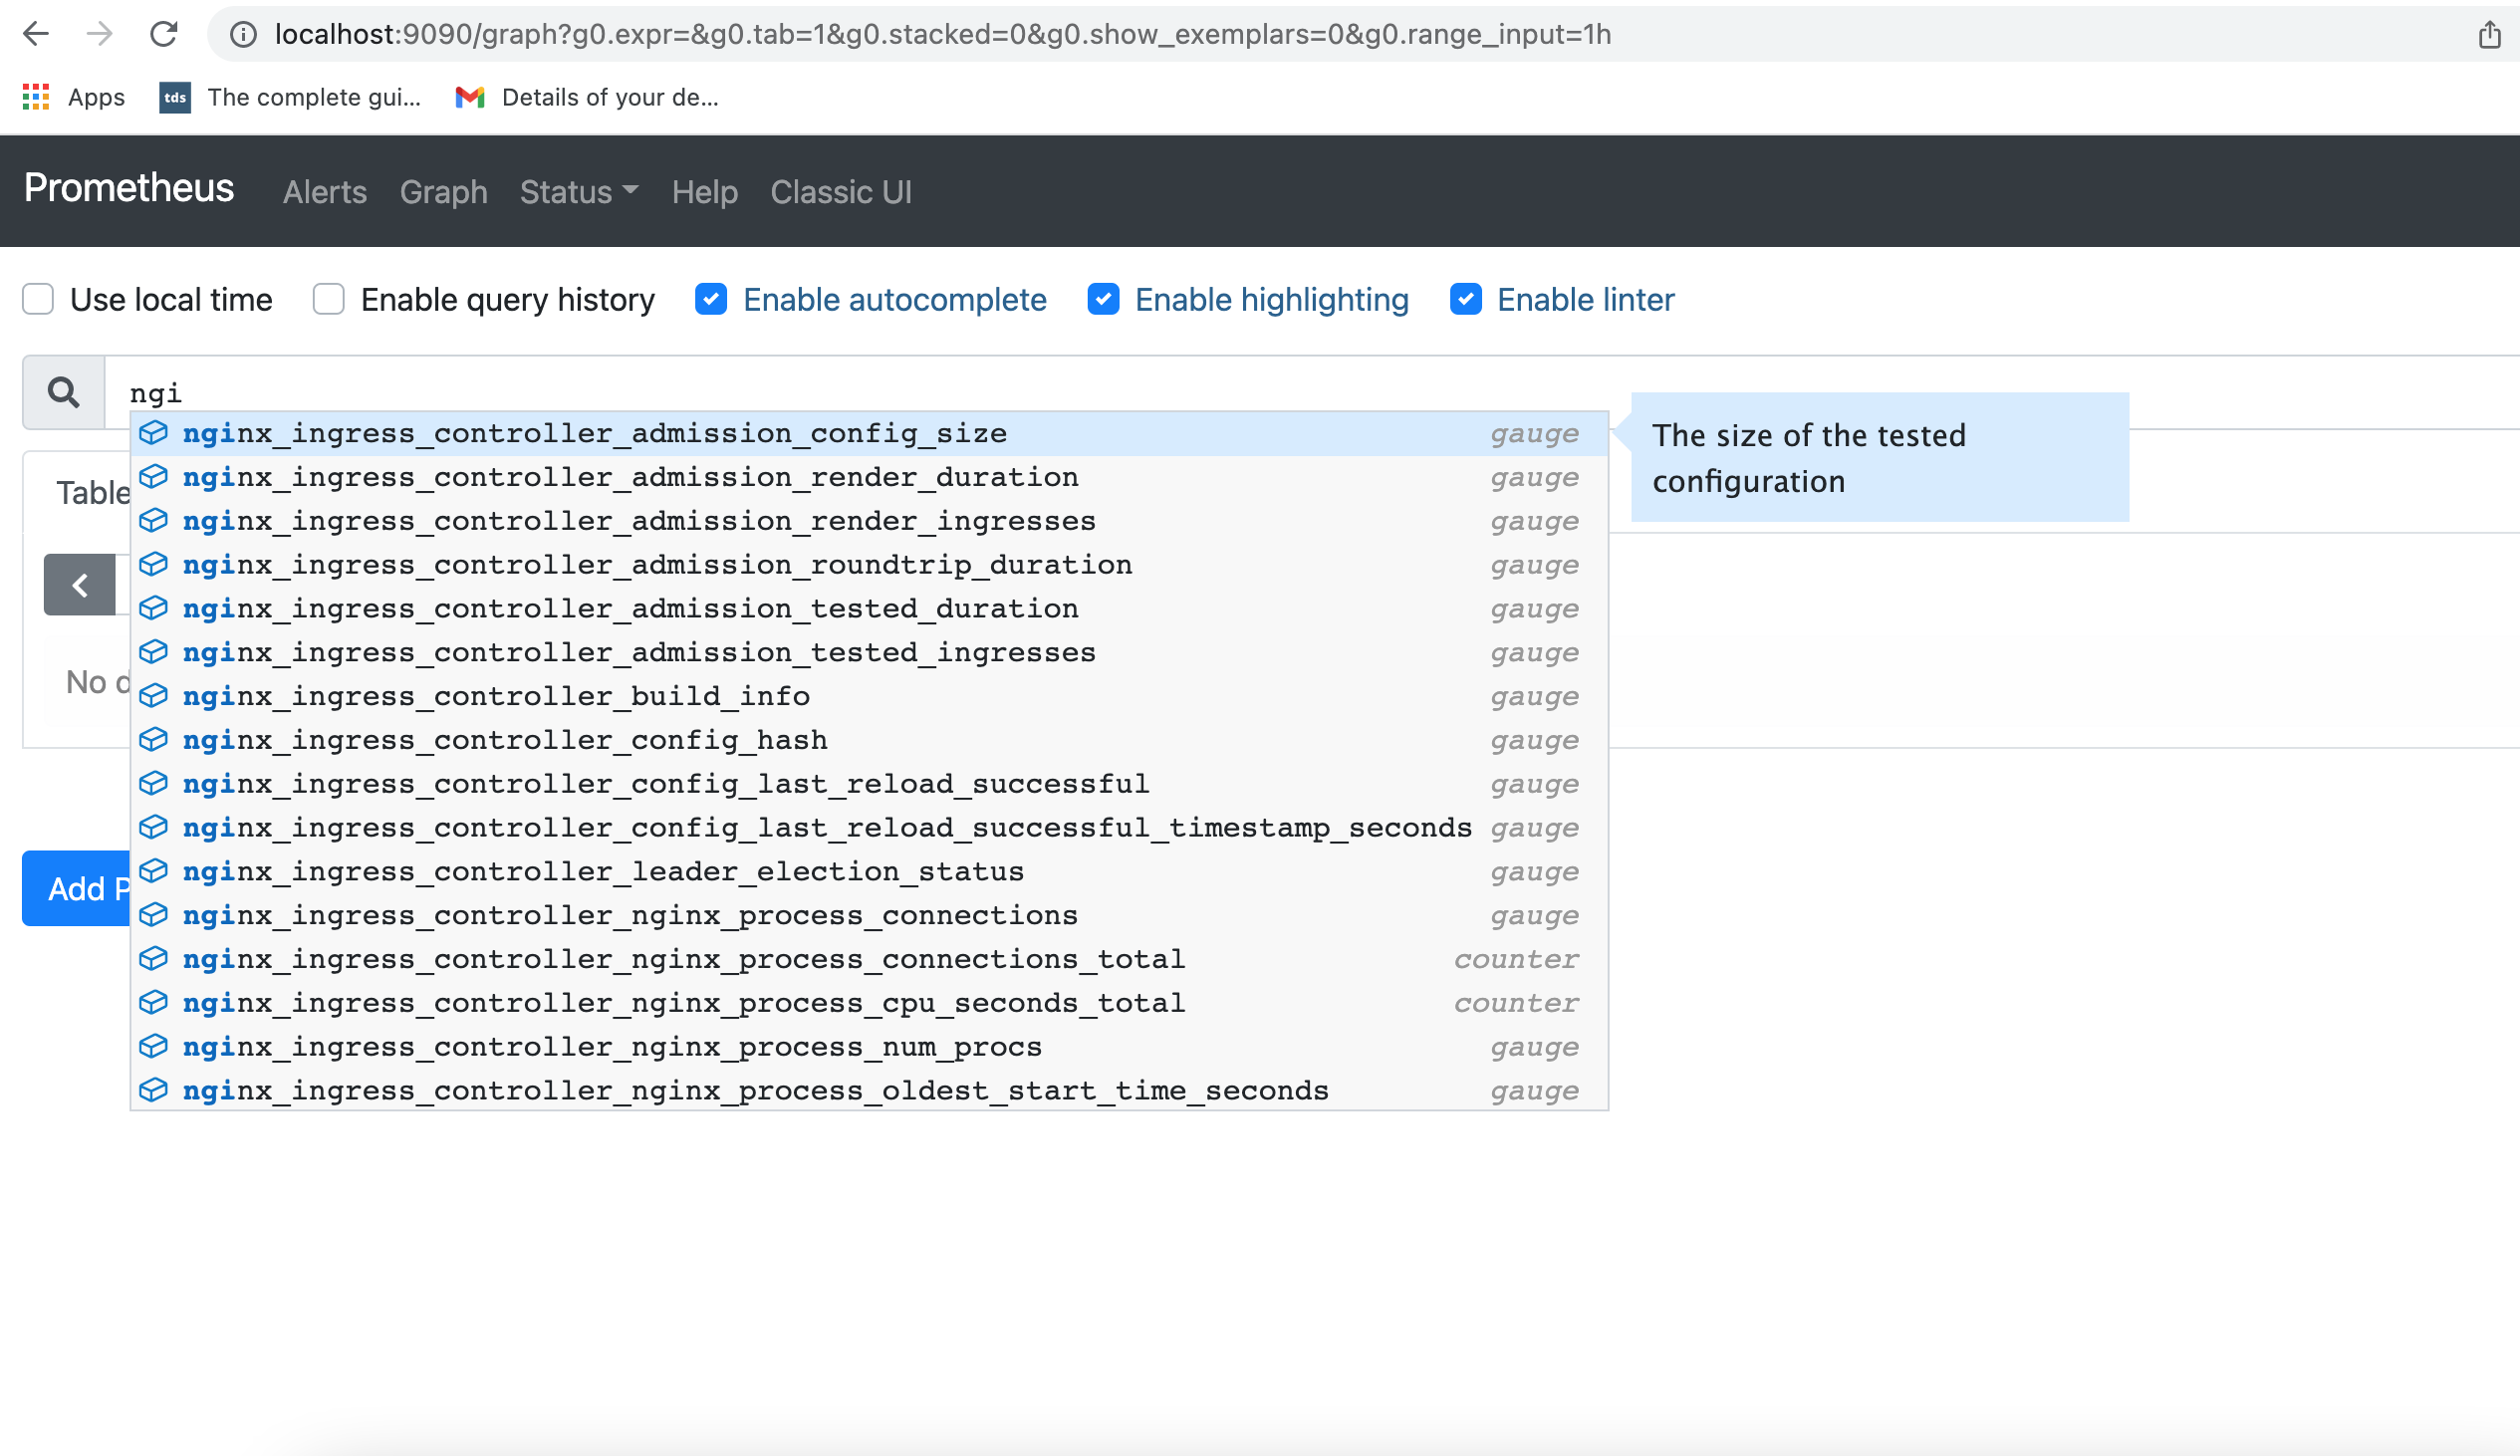
- Enter the details (note: I used http://10.102.72.134:9090 which is the CLUSTER-IP for Prometheus service)
- Left menu (hover over +) -> Dashboard
- Click "Import"
- Enter the copy pasted json from https://raw.githubusercontent.com/kubernetes/ingress-nginx/main/deploy/grafana/dashboards/nginx.json
- Click Import JSON
- Select the Prometheus data source
- Click "Import"
Exposed metrics 
Prometheus metrics are exposed on port 10254.
Request metrics 
-
nginx_ingress_controller_request_duration_secondsHistogram\ The request processing (time elapsed between the first bytes were read from the client and the log write after the last bytes were sent to the client) time in seconds (affected by client speed).\ nginx var:request_time -
nginx_ingress_controller_response_duration_secondsHistogram\ The time spent on receiving the response from the upstream server in seconds (affected by client speed when the response is bigger than proxy buffers).\ Note: can be up to several millis bigger than thenginx_ingress_controller_request_duration_secondsbecause of the different measuring method. nginx var:upstream_response_time -
nginx_ingress_controller_header_duration_secondsHistogram\ The time spent on receiving first header from the upstream server\ nginx var:upstream_header_time -
nginx_ingress_controller_connect_duration_secondsHistogram\ The time spent on establishing a connection with the upstream server\ nginx var:upstream_connect_time -
nginx_ingress_controller_response_sizeHistogram\ The response length (including request line, header, and request body)\ nginx var:bytes_sent -
nginx_ingress_controller_request_sizeHistogram\ The request length (including request line, header, and request body)\ nginx var:request_length -
nginx_ingress_controller_requestsCounter\ The total number of client requests -
nginx_ingress_controller_bytes_sentHistogram\ The number of bytes sent to a client. Deprecated, usenginx_ingress_controller_response_size\ nginx var:bytes_sent
# HELP nginx_ingress_controller_bytes_sent The number of bytes sent to a client. DEPRECATED! Use nginx_ingress_controller_response_size
# TYPE nginx_ingress_controller_bytes_sent histogram
# HELP nginx_ingress_controller_connect_duration_seconds The time spent on establishing a connection with the upstream server
# TYPE nginx_ingress_controller_connect_duration_seconds nginx_ingress_controller_connect_duration_seconds
* HELP nginx_ingress_controller_header_duration_seconds The time spent on receiving first header from the upstream server
# TYPE nginx_ingress_controller_header_duration_seconds histogram
# HELP nginx_ingress_controller_request_duration_seconds The request processing time in milliseconds
# TYPE nginx_ingress_controller_request_duration_seconds histogram
# HELP nginx_ingress_controller_request_size The request length (including request line, header, and request body)
# TYPE nginx_ingress_controller_request_size histogram
# HELP nginx_ingress_controller_requests The total number of client requests.
# TYPE nginx_ingress_controller_requests counter
# HELP nginx_ingress_controller_response_duration_seconds The time spent on receiving the response from the upstream server
# TYPE nginx_ingress_controller_response_duration_seconds histogram
# HELP nginx_ingress_controller_response_size The response length (including request line, header, and request body)
# TYPE nginx_ingress_controller_response_size histogram
Nginx process metrics 
# HELP nginx_ingress_controller_nginx_process_connections current number of client connections with state {active, reading, writing, waiting}
# TYPE nginx_ingress_controller_nginx_process_connections gauge
# HELP nginx_ingress_controller_nginx_process_connections_total total number of connections with state {accepted, handled}
# TYPE nginx_ingress_controller_nginx_process_connections_total counter
# HELP nginx_ingress_controller_nginx_process_cpu_seconds_total Cpu usage in seconds
# TYPE nginx_ingress_controller_nginx_process_cpu_seconds_total counter
# HELP nginx_ingress_controller_nginx_process_num_procs number of processes
# TYPE nginx_ingress_controller_nginx_process_num_procs gauge
# HELP nginx_ingress_controller_nginx_process_oldest_start_time_seconds start time in seconds since 1970/01/01
# TYPE nginx_ingress_controller_nginx_process_oldest_start_time_seconds gauge
# HELP nginx_ingress_controller_nginx_process_read_bytes_total number of bytes read
# TYPE nginx_ingress_controller_nginx_process_read_bytes_total counter
# HELP nginx_ingress_controller_nginx_process_requests_total total number of client requests
# TYPE nginx_ingress_controller_nginx_process_requests_total counter
# HELP nginx_ingress_controller_nginx_process_resident_memory_bytes number of bytes of memory in use
# TYPE nginx_ingress_controller_nginx_process_resident_memory_bytes gauge
# HELP nginx_ingress_controller_nginx_process_virtual_memory_bytes number of bytes of memory in use
# TYPE nginx_ingress_controller_nginx_process_virtual_memory_bytes gauge
# HELP nginx_ingress_controller_nginx_process_write_bytes_total number of bytes written
# TYPE nginx_ingress_controller_nginx_process_write_bytes_total counter
Controller metrics 
# HELP nginx_ingress_controller_build_info A metric with a constant '1' labeled with information about the build.
# TYPE nginx_ingress_controller_build_info gauge
# HELP nginx_ingress_controller_check_success Cumulative number of Ingress controller syntax check operations
# TYPE nginx_ingress_controller_check_success counter
# HELP nginx_ingress_controller_config_hash Running configuration hash actually running
# TYPE nginx_ingress_controller_config_hash gauge
# HELP nginx_ingress_controller_config_last_reload_successful Whether the last configuration reload attempt was successful
# TYPE nginx_ingress_controller_config_last_reload_successful gauge
# HELP nginx_ingress_controller_config_last_reload_successful_timestamp_seconds Timestamp of the last successful configuration reload.
# TYPE nginx_ingress_controller_config_last_reload_successful_timestamp_seconds gauge
# HELP nginx_ingress_controller_ssl_certificate_info Hold all labels associated to a certificate
# TYPE nginx_ingress_controller_ssl_certificate_info gauge
# HELP nginx_ingress_controller_success Cumulative number of Ingress controller reload operations
# TYPE nginx_ingress_controller_success counter
# HELP nginx_ingress_controller_orphan_ingress Gauge reporting status of ingress orphanity, 1 indicates orphaned ingress. 'namespace' is the string used to identify namespace of ingress, 'ingress' for ingress name and 'type' for 'no-service' or 'no-endpoint' of orphanity
# TYPE nginx_ingress_controller_orphan_ingress gauge
Admission metrics 
# HELP nginx_ingress_controller_admission_config_size The size of the tested configuration
# TYPE nginx_ingress_controller_admission_config_size gauge
# HELP nginx_ingress_controller_admission_render_duration The processing duration of ingresses rendering by the admission controller (float seconds)
# TYPE nginx_ingress_controller_admission_render_duration gauge
# HELP nginx_ingress_controller_admission_render_ingresses The length of ingresses rendered by the admission controller
# TYPE nginx_ingress_controller_admission_render_ingresses gauge
# HELP nginx_ingress_controller_admission_roundtrip_duration The complete duration of the admission controller at the time to process a new event (float seconds)
# TYPE nginx_ingress_controller_admission_roundtrip_duration gauge
# HELP nginx_ingress_controller_admission_tested_duration The processing duration of the admission controller tests (float seconds)
# TYPE nginx_ingress_controller_admission_tested_duration gauge
# HELP nginx_ingress_controller_admission_tested_ingresses The length of ingresses processed by the admission controller
# TYPE nginx_ingress_controller_admission_tested_ingresses gauge
Histogram buckets 
You can configure buckets for histogram metrics using these command line options (here are their default values): * --time-buckets=[0.005, 0.01, 0.025, 0.05, 0.1, 0.25, 0.5, 1, 2.5, 5, 10] * --length-buckets=[10, 20, 30, 40, 50, 60, 70, 80, 90, 100] * --size-buckets=[10, 100, 1000, 10000, 100000, 1e+06, 1e+07]